Warning: The content of this article may be out of date.
A powerful new tool is available for web developers for use in many Mozilla-based products, including Firefox, Mozilla Suite and Netscape 7.x. The JavaScript debugger, also called Venkman, has been a part of the Mozilla browser and the community of web and script developers there for some time. This article provides an overview and some practical examples of using the JavaScript debugger in web applications and web page scripting. This introduction is the first in a series of articles on Venkman and JavaScript debugging. Even if you are already using Venkman, the features, procedures, and tips described here will make you a more confident web developer and debugger.
Venkman is both a graphic and a console debugger. Features such as breakpoint management, call stack inspection, and variable/object inspection are available from the user interface and from console commands, letting you work in the way you are most accustomed to. The interactive console also allows for execution of arbitrary JavaScript code. Venkman's keyboard shortcuts are the same as leading visual debugging environments, and gdb users should be familiar with Venkman's /break, /step, /next, /finish, /frame, and /where commands.
On Windows, the JavaScript debugger compares favorably with Visual Interdev and other large web development tools. On other platforms, including Mac OS and Unix, it is alone in offering this degree of flexibility, depth, and power in a visual debugging environment.
Starting the Debugger
The JavaScript Debugger is automatically pre-installed in Mozilla 1.x but must be installed separately in Firefox and other Gecko-based products, such as Thunderbird and Netscape 7.x. Fortunately, the XPInstall technology makes it possible to install new application modules in Firefox by just clicking a hyperlink.
If you don't already have Venkman or would like to upgrade, you can easily get the latest version from Firefox Add-ons. The installation process is two steps. First, from within the browser you want to host the debugger application, visit the Firefox Add-ons page and click on the "install" link for the most recent version. When the download is complete, restart your browser (some Windows users may also need to restart their computer as well). You can then access the debugger via a new, dynamically created menuitem in the Tools menu of that browser, or else restart the browser with a special debugger option.
To see which version of Venkman you have, type /version in the Interactive Session view. For more information about the latest improvements and versions, see the Venkman Development Page.
There are two ways to start the debugger:
- From Firefox, you can start it by selecting JavaScript Debugger from the Tools menu (Tools->Web Development menu in Mozilla 1.x and Netscape).
- You can also start the browser with the
-venkmancommand line option, which launches Venkman initially instead of an application front end.
(Note that Venkman displays usage data when it starts up: "Recorded local startup X, global YYY." This data comes from a counter built in to the application. For more information about this counter and the data, see Item 2.2 in the Venkman FAQ.)
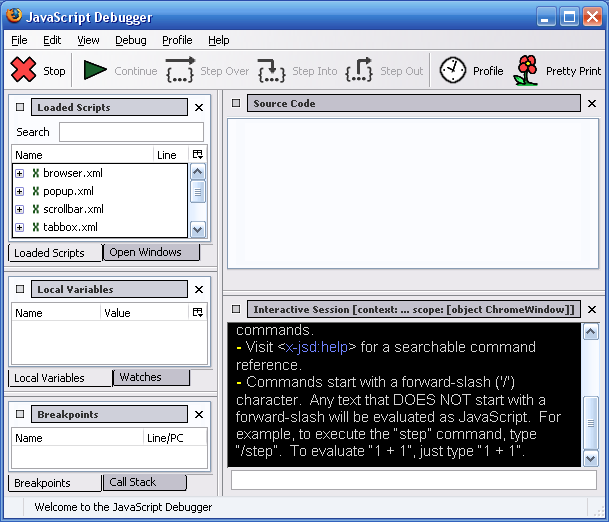
When you first start Venkman, the basic views are arranged as in the screenshot above—though you can customize the layout and presence of the different views however you want, as we describe in the View Customization section below. The scripts that have been loaded by the JavaScript engine appear in the Loaded Scripts window (for more information about how scripts are loaded and accessed in Venkman, see "Loading Scripts into the Debugger").

The menubar, toolbar, and all of the views can be collapsed or hidden, giving you a lot of control over the debugging environment. The Source Code View is empty until you select a script, and The Interactive Session View starts up with basic startup information.
Each of the views has a label, a float button that lets you display the view in its own window, and a close button that puts the view away until you want to display it again, as seen in Figure 2.
The following section describes these views and their use within the interface as a whole.
Getting Acquainted with Venkman's User Interface
Toolbar

The Toolbar is located at the top of the debugger. The Toolbar contains icons for Stop, Continue, Step Over, Step Into, Step Out, Profile, and Pretty Print commands. These commands should be self explanatory, with the possible exception of Stop, which causes the debugger to stop when the next line of JavaScript is executed, and the Profile button, which can be used to measure execution times for your scripts. When you enable profiling by clicking this button, a green checkmark appears next to the button and profile data for every function is collected, and can be saved by choosing Save Profile Data As... from the Profile menu.

Figure 4.
Stop Button
Waiting for
Execution
Also note that when you are currently executing JavaScript and click the Stop button, the JavaScript stops immediately. If you are not running JavaScript and click the Stop button, it will display "...", as in the Figure 4, to indicate that the debugger will stop at the next instruction, but doesn't have anywhere to stop yet.
This quick stop mode reflects a common scenario in JavaScript debugging, which is to inspect and debug scripts while they are running, as on a page where elements are moved around dynamically with DHTML. You can also use commands available in the Debug menu and from the console to stop at errors or at exceptions.
The Continue button to the right of the Stop button dismisses the Stop mode and specifies that scripts should be executed normally, without pausing as each statement is executed.
The Pretty Print button toggles Pretty Print mode. While in Pretty Print mode, the contents of the source view will contain the decompiled source text for the selected function. This is the same text you would get from the toSource method of the Function prototype. If the source text you are debugging is poorly formatted, Pretty Print can help make it easier to read by inserting line breaks and whitespace in appropriate places.
When Pretty Print is enabled you will see a green check mark on the toolbar button, and the menu item will be checked as well.
The Loaded Scripts View

The Loaded Scripts View is in the top left portion of the window. When a file is loaded by the browser it will appear in this view, and when unloaded it will be removed. Files are listed in alphabetical order, grouped by file type. File names are displayed after a color coded, single letter icon representing the file extension. Figure 6 shows the table of icon and file types. At the time if this writing, the order and grouping of file names cannot be changed.
| Icon | File type |
|---|---|
 |
.js |
 |
.html, .htm |
 |
.xul |
 |
.xml |
 |
All other files |
 |
JavaScript function |
Figure 6.
Icons in the Script View
The "special" function name __toplevel__ is displayed for scripts that are not part of an actual function. Clicking on a file name brings you to the top of that file, while clicking on a function name brings you to the start of that function.
The Line column in this view displays the line number that this function starts on. The column picker for this view (the  box on the top right) can be used to display a Length column. This column displays the size of functions, in lines. Both the Line and Length column are blank for file names.
If a function has a breakpoint in it, a small red dot will show up in the function icon, as well as the parent's file icon.
The Local Variables View

The Local Variables view is on the left portion of the window, at the bottom. When the debugger is stopped, the Local Variables view displays values for the current function. The scope object holds all arguments and local variables, and the this object holds the value of the this keyword.
| e | Enumerable property |
| r | Read Only property |
| p | Permanent (cannot be deleted) |
| A | Alias to another property |
| a | Argument to a function |
| v | Declared with var |
Figure 8. Property flags
Properties of both scope and this objects are listed alphabetically, grouped by data type. Figure 9 shows which icons represent which data types.
Properties which are of the type Object are displayed with the name of their constructor function in curly braces as their value. You can locate the source code of the constructor by selecting "Find Constructor" from the property's context menu. You can find the place where the object was instantiated with the "Find Creator" command. By default, properties of type function are not displayed, in order to conserve space in the view. If you would like to have functions displayed, check the "Include Functions" menu item in the view's context menu. You may need to close and re-open any objects you had open to see the change.
Properties that show up in a bold grey font are defined on an object from the prototype chain, and not on the actual object you are inspecting. If you would like to inspect the object's prototype and parent chains, check the "Include ECMA Properties" menu item in the view's context menu. If a property shows up in a bold red font, an exception occurred when Venkman tried to read the value. The exception object will appear as the value of the property.
| Icon | Data Type | Icon | Data Type |
|---|---|---|---|
 |
Void (undefined) value |  |
Null value |
 |
Boolean value |  |
String value |
 |
Integer value |  |
Double value |
 |
Object value |  |
Function value |
Figure 9. Type Icons
The column picker for this view (the box on the top right) can be used to display Type and Flags columns. The Type column contains a textual description of the type of the object. Flags lists one or more applicable flags for this object. Flags are shown enumerated in Figure 8.
If an item visible in the Local Variables View is modified via the Interactive Session View the modification will be immediately reflected in the Local Variable View.
At the time of this writing, the Local Variables View's default sort order and grouping are not adjustable.
The Call Stack View
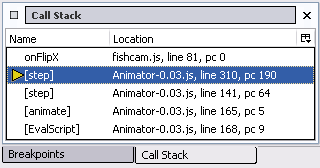
The Call Stack View is on the left portion of the window by default, at the bottom. When the debugger is stopped, the Call Stack View displays the list of active functions. The function at the top of the Call Stack View is the one in which the debugger stopped, the function below it is the caller, below that is the caller's caller, and so on. These items are referred to as stack frames.
Double-clicking on a stack frame will change the "current" frame. This will cause the source of function to be displayed in the Source Code view, the Local Variables view will change to display variables local to the selected stack frame, and script evaluated in the Interactive Session view will be relative to the selected frame.
If you would like to copy the current call stack to the clipboard, select "Dump Stack to Interactive Session" from the context menu, or type /where in the Interactive Session view. You may then copy the text from the Interactive Session view.
If you would like to keep Venkman from stopping in a particular stack frame in the future, check "Don't Debug" from the stack frame's context menu.
Source Code View

The Source Code View is a read-only file viewer. Files and specific functions within them can be displayed by selecting the appropriate file or function name in the Script View.
When script execution is interrupted by the debugger, the line of the file where the interruption occurred is automatically displayed in the Source Code View. The line in question will be highlighted in yellow to make it easy to spot.
Clicking in the left margin of this view will set a breakpoint at that line. If the breakpoint is successfully set, the margin will show the letter "B" on a red background, and both the Loaded Scripts View and Interactive Session View will provide feedback. The breakpoint can be cleared by clicking in the margin again (on the letter "B"). Breakpoints cannot be set on lines which do not contain executable code, such as blank and comment lines. For these lines, the Interactive Session View will display an error message explaining why the breakpoint could not be set.
Breakpoints can also be set and cleared from the Interactive Session View, with the break and fbreak commands. The break command takes a file pattern and line number. Any loaded file which matches the file pattern, and contains an executable line at the requested line number will have a breakpoint set. If no loaded files match the file pattern or line number, an error message is printed to the console and the command fails. The fbreak command is identical, with the exception that if no files match the pattern or line, a "future breakpoint" is recorded. The next time a file is loaded that matches the pattern and line, a breakpoint will be set. In this way, fbreak allows one to set breakpoints in files that are not yet loaded, as well as set breakpoints that are triggered when a file is loaded.
The Interactive Session View
Another basic view in Venkman is the actual Interactive Session View, which allows you to interact with the debugger from a command line.
Commands are entered in the text box, and responses are appended to the end of the output. Type /commands in the input area (the text box) to list all of the commands available. The /help command can be used to get additional information about a specific command. You can type /help next, for example, to see how to use the next command.
The input area supports command history and tab-completion for command names. Command history remembers the last 20 commands entered. The up and down arrows can be used to revisit these previous commands. Tab completion allows the user to type the first portion of a command, and press tab twice to see possible completions. If only one command matches, it will be auto-completed on the first tab.
View Customization
Venkman offers nearly complete control over the arrangement and display of views within the application. The debugger is built on top of an application framework that allows you to drag and drop, resize, and toggle all the available views, and even to create new views or modules for the debugger if you choose—though this latter is an advanced topic and a subject for a future article.
To remove a view from Venkman, simply click the Close button at the top right of that view. When the view again becomes necessary—for example, when you open a source file from the Loaded Scripts view and want to view the source—the view reappears where it was last positioned. To make a view reappear explicitly, select it from the View->Show/Hide menu of the debugger. You can also make views float in their own separate windows. To make a view float, click the float button in the upper left of that view.
You can access any of the basic views from the Show/Hide submenu of the View menu. The list displayed there includes all of the basic views in Venkman. As you change which views are displayed and where in the UI they appear, your preferences are stored and persisted across sessions.
Loading Scripts into the Debugger
Whether or not you start Venkman first or the browser component, when the Mozilla suite starts up, the JavaScript engine begins to keep track of and compile all the scripts that are loaded in web pages and in the various Mozilla user interfaces themselves. The engine tells Venkman about the scripts it knows about, and those scripts are loaded into the "Loaded Scripts" view in the debugger.
If you want to load new scripts in—say from a web page you are trying to troubleshoot—you can do so by simply opening that web page in the regular browser window, at which point the compiler gets the JavaScript source and populates the Loaded Scripts window with the new entry.
Using File->Open from Venkman will open a local file in the debugger, and using File->Open Web Location will open and display the entire HTML contents of the requested page. Probably, neither of these is what you really want. Since the JavaScript engine automatically populates the Loaded Scripts list in the debugger with JavaScript it executes as the browser opens web pages, it's usually enough simply to browse the sites whose scripts you are interested in debugging.
Debugging Basics
This section provides a brief example of a debugging session in order to familiarize you with some of the basic commands and operations of the debugger.
-
Start Venkman
Note: At one point, the debugger needed to be started before the scripts it was going to debug. This limitation is fixed, and now the JavaScript compiler makes all the scripts you access via the browser available to the debugger. See Loading Scripts into the Debugger for more information about finding and loading scripts in Venkman.
-
Launch a browser window and go to http://wp.netscape.com/fishcam/dhtmltank.html.
Note that in Mozilla 1.x and Netscape 7.x, the debugger contains a Window menu like other major components in the application suite. From this menu, you can access the browser, mail, and other applications.
-
Type
/break Animator-0.03 121in the debugger.The console command
/breakis used to set and list breakpoints. The first parameter is the file name that contains the JavaScript you want to break at. The second parameter is the line number. You don't need to specify the entire file name. In this example, we are setting a breakpoint in thepausefunction called when the browser starts the DHTML fishcam window.Alternately, you can select
Animator-0.03.jsfrom the Loaded Scripts view, locate thepausefunction at line 119, and click in the left margin. Setting breakpoints in this manner is equivalent to using the/breakcommand in the console. In either case, a red breakpoint icon appears in the Source Code view. -
Type
/breakin the debugger.If you don't provide arguments to the
/breakcommand, all breakpoints are listed in the Interactive Session view. -
On the fishcam page, press the "pause" link.
You should hit the breakpoint you just set in Step 3.
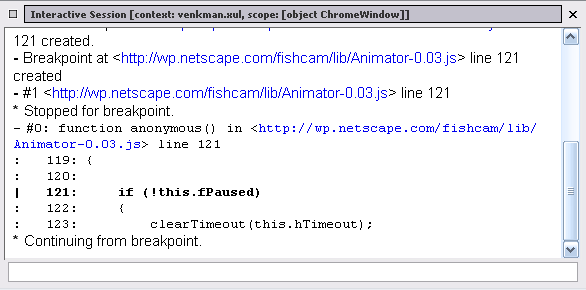
In the interactive session, context becomes
Animator-0.03.jsand the scope is thepausefunction. There will also be "stopped for breakpoint" in red in the interactive session, along with the file name, line number, and snippet source code from where it stopped.
Figure 13. (from Step 5) Stopped at a breakpoint. -
In the interactive session's input field, enter
this.fPausedVenkman evaluates the expression, giving you [boolean]
falseback. Press Step Into to follow the steps until you have finished debugging the function, and the fishes have paused.In addition to Step In, which will execute a single line of JavaScript and stop, Step Over can be used to step over a impending function call, and return control to the debugger when the call returns. Step Out executes until the current function call exits.
-
Click the "pause" link again on the fishcam page to resume the demo.
This starts the DHTML down the other codepath in
start()and makes the fishes start swimming again.
As you can see, this is a very modest introduction to the functionality of the JavaScript debugger and the complexity that scripts can have. But the steps described here can give you a basic feel for the debugger if you haven't already had some experience using it, and they provide the basis for the more interesting and practical examples in the articles that follow this one.
The best way to get to know Venkman, of course, is to play around with it — to set it up in the way that makes the most sense to you, to try loading scripts and setting breakpoints, evaluating expressions in the Interactive Session View, watching the values of variables as they change when scripts are executed, getting profile data.
Debugging extensions
Although at first glance it might seem that Venkman cannot debug extensions, doing so is in fact fully supported; it's just disabled by default.
To debug your extension with Venkman (XUL files and their attached JS files), you'll have to load browser and extension files into Venkman by unchecking Debug > Exclude Browser Files.
Resources
- Using Breakpoints in Venkman — next article about Venkman.
- Venkman's home page on MDC.
Original Document Information
- Authors: Ian Oeschger, Robert Ginda