

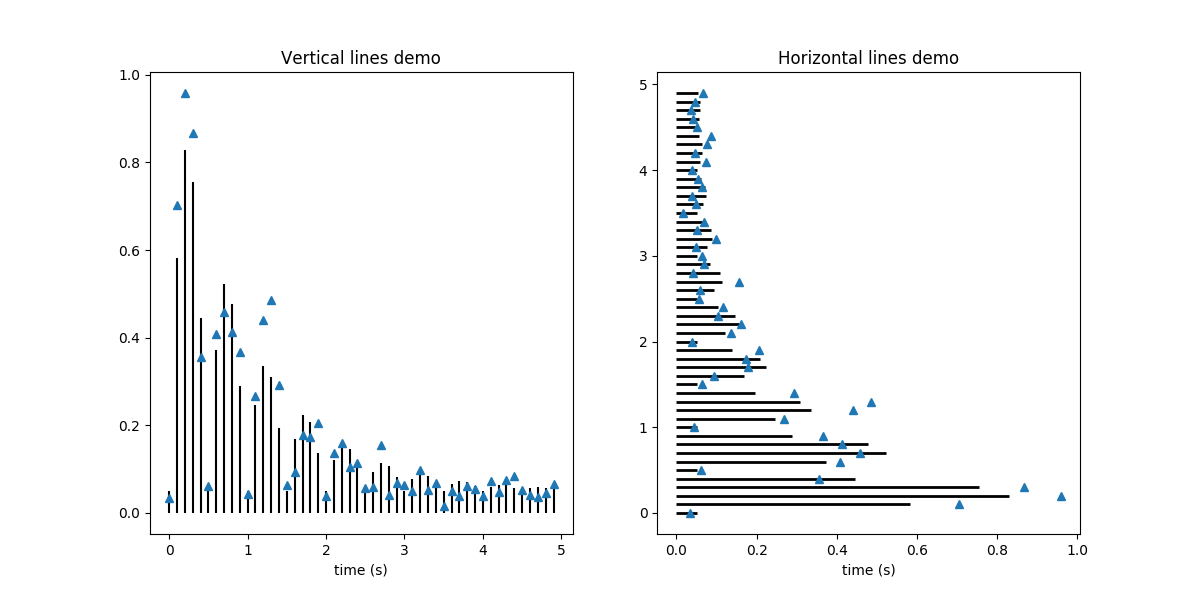
Axes.vlines(x, ymin, ymax, colors='k', linestyles='solid', label='', **kwargs)¶Plot vertical lines.
Plot vertical lines at each x from ymin to ymax.
| Parameters: | x : scalar or 1D array_like
ymin, ymax : scalar or 1D array_like
colors : array_like of colors, optional, default: ‘k’ linestyles : [‘solid’ | ‘dashed’ | ‘dashdot’ | ‘dotted’], optional label : string, optional, default: ‘’ |
|---|---|
| Returns: | lines : |
| Other Parameters: | |
kwargs : |
|
See also
hlinesExamples
(Source code, png, pdf)

Note
In addition to the above described arguments, this function can take a data keyword argument. If such a data argument is given, the following arguments are replaced by data[<arg>]: