

Axes.acorr(x, **kwargs)¶Plot the autocorrelation of x.
| Parameters: | x : sequence of scalar hold : boolean, optional, deprecated, default: True detrend : callable, optional, default:
normed : boolean, optional, default: True
usevlines : boolean, optional, default: True
maxlags : integer, optional, default: 10
|
|---|---|
| Returns: | (lags, c, line, b) : where: |
| Other Parameters: | |
linestyle :
marker : string, optional, default: ‘o’ |
|
Notes
The cross correlation is performed with numpy.correlate() with
mode = 2.
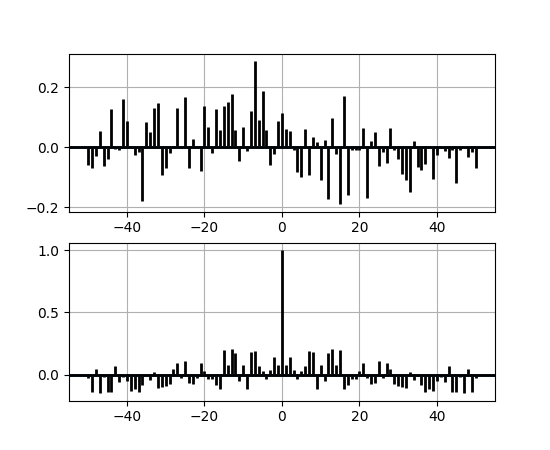
Examples
xcorr is top graph, and
acorr is bottom graph.
(Source code, png, pdf)
Note
In addition to the above described arguments, this function can take a data keyword argument. If such a data argument is given, the following arguments are replaced by data[<arg>]: